TAKEOFF
§ 91.103 Preflight action.
Each pilot in command shall, before beginning a flight, become familiar with all available information concerning that flight. This information must include –
- For any flight, runway lengths at airports of intended use, and the following takeoff and landing distance information:
- (1) For civil aircraft for which an approved Airplane or Rotorcraft Flight Manual containing takeoff and landing distance data is required, the takeoff and landing distance data contained therein;
- For every take off that a pilot performs they must determine what factors effect the performance of the aircraft in the take off
- Pilots must calculate their takeoff distance accordingly to several variables, prior to flight, to ensure adequate performance.
- It is important to realize that any calculated performance may be different from what is experienced during taking off.
Takeoff Distance Variables:
- Gross Weight:
- As gross weight increases, the difference between nose-wheel lift-off and takeoff speed decreases
- When an instructor is not in the plane, the pitch attitude may differ
- The aircraft will be airborne sooner, climb more rapidly, and have higher performance
- Power Settings:
- Applying power to quickly may yaw the aircraft to the left due to torque, most apparent in high-powered engines
- Flight Profile Flown:
- The Pilot Operating Handbook/Airplane Flight Manual will specify different configurations and procedures with which to fly
- Flaps: Flaps are considered high-lift devices. Use of flaps allow for the aircraft to create more lift on takeoff, allowing quicker rotation into ground effect, and reducing takeoff distance
- Aircraft must accelerate sufficiently in ground effect however, before continuing a climb
- When lowering flaps, you are changing the chord line which increases the angle of attack (AoA)
- This increase in AoA causes the aircraft’s wing to suddenly create more lift, and therefore the aircraft will “balloon”
- When lowering flaps anticipate this balloon effect by being ready to lower the nose
- Outside Air Temperature:
- Temperature is a key variable in determining density altitude
- As temperature rises, so does density altitude
- Conversely, density altitude drops with temperature
- Field Elevation/Density Altitude:
- The field elevation is irrelevant besides the fact that it correlates to starting at a higher density altitude
- While density altitude can actually be lower than field elevation, an aircraft on that same day at a lower altitude would almost definitely experience a lower density altitude as well, barring any sort of environmental phenomena
- Consider planning to the 70/50 rule for takeoff, whereby if you haven’t achieved 70% of your rotation speed by 50% of the runway, you should abort
- Surface Winds:
- The winds impact how air flows over the wing of an aircraft
- Headwinds work with the motion of the aircraft to increase flow while tailwinds push against the normal flow of air
- As a result, with a headwind, the airplane already feels some sort of airflow over the wings before it starts to roll, thereby increasing lift and resulting in a shorter takeoff roll
- With a tailwind you would have increased speed to develop minimum lift causing stress on tire and increased takeoff distance
- Tailwind impacts are often far more detrimental than many realize
- They increase runway required to takeoff
- They also may decrease directional stability, particularly before control surfaces have the authority to counteract
- Runway Slope:
- Airports are not perfectly flat and they will have some variance in altitude from one end to another, especially at large airfields
- Much like when driving a car, moving an airplane uphill requires the engine to work harder to accelerate which results in a longer time to reach rotation speeds, increasing takeoff roll
- Conversely, taking off down hill allows for faster acceleration resulting in a shorter takeoff roll
- When available, runway slope data will be provided. Runway slope will be shown only when it is 0.3 percent or greater. On runways less than 8000 feet, the direction of the slope up will be indicated, e.g., 0.3% up NW. On runways 8000 feet or greater, the slope will be shown (up or down) on the runway end line, e.g., RWY 13: 0.3% up., RWY 31: Pole. Rgt tfc. 0.4% down
- Aircraft slope can be determined by referencing the airport diagram found in the Chart Supplement U.S. or online at FAA.gov, or commercial sources
- Windshear:
- Wind shear is a change in wind speed and/or direction over a short distance
- It can occur either horizontally or vertically and is most often associated with strong temperature inversions or density gradients
- Four common sources of low-level wind shear are:
- Frontal activity
- Thunderstorms
- Temperature inversions
- Surface obstructions
- If available, utilize information from Low-Level Wind Shear and Microburst Detection Systems
Runway Surface Condition:
Runway surface condition (RSC) is a critical factor in aviation safety, affecting aircraft performance during takeoff, landing, and ground operations. Various conditions such as dry, wet, contaminated, icy, or snowy runways can significantly impact aircraft handling, braking efficiency, and overall safety. Here are some key considerations for runway surface conditions:
Types of Runway Surface Conditions:
- Dry Runway: Offers optimal friction and is ideal for takeoff and landing.
- Wet Runway: Reduces friction and can lead to hydroplaning, affecting braking performance.
- Contaminated Runway: Covered by substances such as snow, ice, slush, or standing water, leading to significant reductions in friction.
- Icy Runway: Extremely low friction, posing severe challenges for braking and control.
- Snow-Covered Runway: Can vary from packed snow to loose snow, affecting both friction and directional control.
Measuring and Reporting Runway Conditions:
- Runway Condition Assessment Matrix (RCAM): A standardized method used to assess and report runway surface conditions, including the type and depth of contamination.
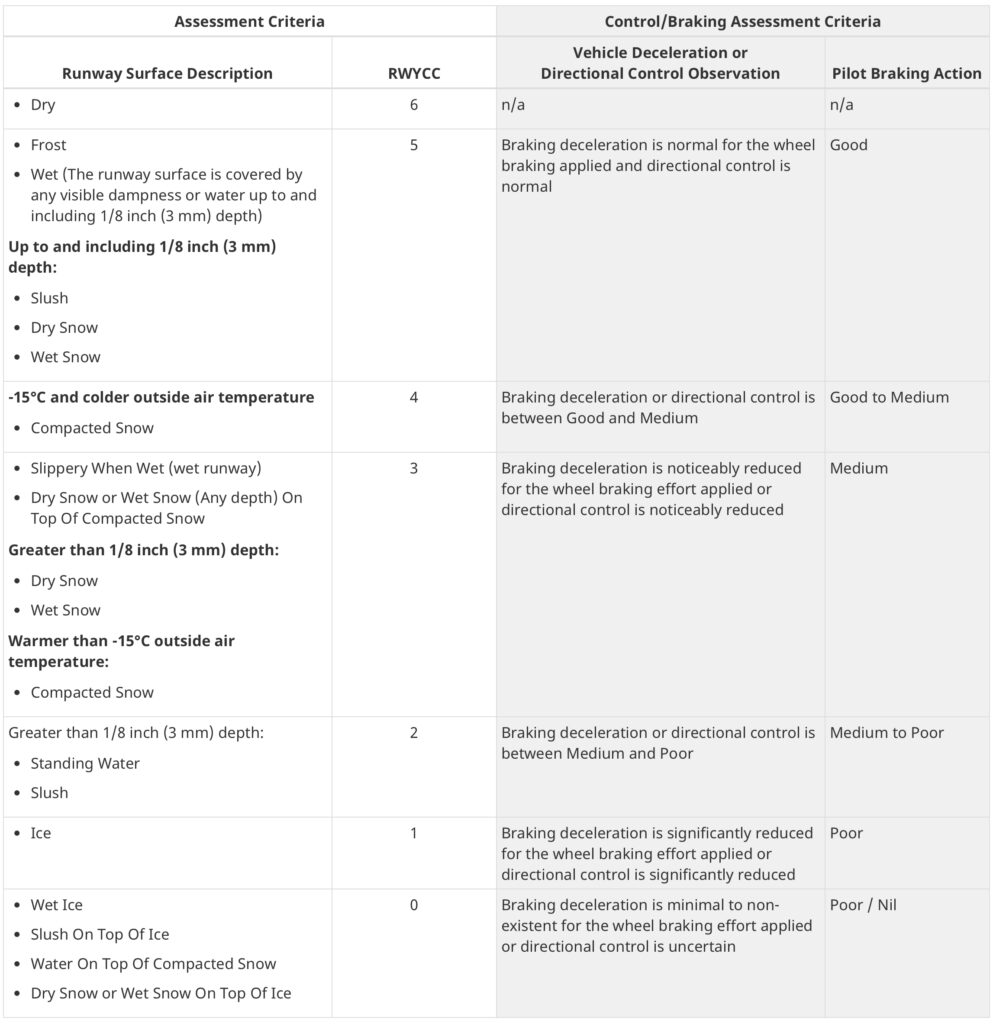
The Runway Condition Assessment Matrix (RCAM) is a standardized tool used to assess and report runway surface conditions. The RCAM helps translate runway surface conditions into Runway Condition Codes (RCCs), which pilots and airport operators can use to make informed decisions about aircraft operations.
Application and Reporting
- Airport Operators: Assess runway conditions regularly and report the RCC to pilots and air traffic control.
- Pilots: Use RCCs to determine takeoff and landing performance, adjusting procedures based on the reported conditions.
- Air Traffic Control: Disseminate RCC information to aircraft operators and provide updates as conditions change.
Example of RCAM Usage
Imagine an airport reports the following conditions on its primary runway:
“Runway conditions 5 – 5- 5 “
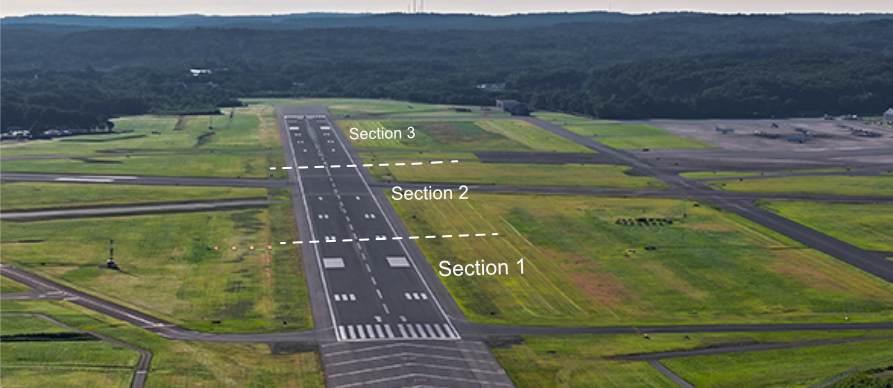
The runway is reported with the corresponding RCCs for each section, allowing pilots to understand the varying conditions along the runway and plan their operations accordingly.
- Section 1: Wet (RCC 5)
- Section 2: Wet (RCC 5)
- Section 3: Wet (RCC 5)
Wet means the runway surface is covered by any visible dampness or water up to and including 1/8 inch (3 mm) depth. Braking deceleration is normal for the wheel braking applied and directional control is normal.
The Control/Braking Assessment Criteria (right shaded half of RCAM) provides the criteria that the airport and aerodrome operators use to determine if the RWYCC accurately reflects the slipperiness of the runway. The Control/Braking Assessment Criteria on the version of RCAM used by flight crews includes:
3. Operational Considerations:
- Braking Action Reports: Pilots’ reports on braking effectiveness, ranging from good to nil, assist in evaluating current runway conditions.
- Aircraft Performance Adjustments: Based on runway conditions, pilots may need to adjust takeoff and landing speeds, and distances, and consider the use of different flap settings or thrust reversers.
- Contingency Planning: Preparing for potential diversions or delays due to deteriorating runway conditions is crucial.
4. Safety Measures and Best Practices:
- Regular Inspections and Maintenance: Ensuring runways are free from debris, timely snow and ice removal, and proper drainage systems to avoid water accumulation.
- Pilot Training: Emphasizing the importance of understanding and reacting to various runway surface conditions, including simulator training for adverse scenarios.
- Communication: Efficient and timely communication between airport authorities, air traffic control, and flight crews regarding runway conditions.
5. Technological Advancements:
- Enhanced Weather Prediction Models: Improved accuracy in forecasting weather conditions that affect runway surfaces.
- Advanced Ground Support Equipment: Modern snow removal and de-icing equipment to maintain runway conditions.
- Automated Surface Condition Monitoring: Implementation of sensors and IoT devices to provide real-time data on runway surface conditions.
Conclusion:
Understanding and managing runway surface conditions are pivotal for aviation safety. Continuous assessment, effective communication, and adherence to best practices ensure that pilots can make informed decisions, ultimately safeguarding passengers, crew, and aircraft during ground operations.
Pavement, grass, gravel, water, snow, ice, rubber slicks
Consider increasing margins for aborting takeoff to avoid losing control during an abort
- Nose Strut:
- Nose-wheels do more than for just taxi and shock absorption but also to aid in bouncing the aircraft upward. Ensure the nose-wheel is in good condition with sufficient damper showing during pre-flight inspections:
- Tire Pressure
- Braking effectiveness is a factor of tire pressure
- Pressure also impacts the speed at which hydroplaning can occur
- Fly in accordance with the aircraft’s Pilot Operating Handbook
Published vs. Realized Performance:
- Although general aviation charts found in the POH/AFM do not consider every variable, it is important to have an understanding of the various conditions that may exist
- If not published, the conditions were likely most ideal, with a new engine, and flown by an experienced test pilot
- It is highly recommended to add up to a 50% safety margin to any performance number before pushing the performance limits of an aircraft
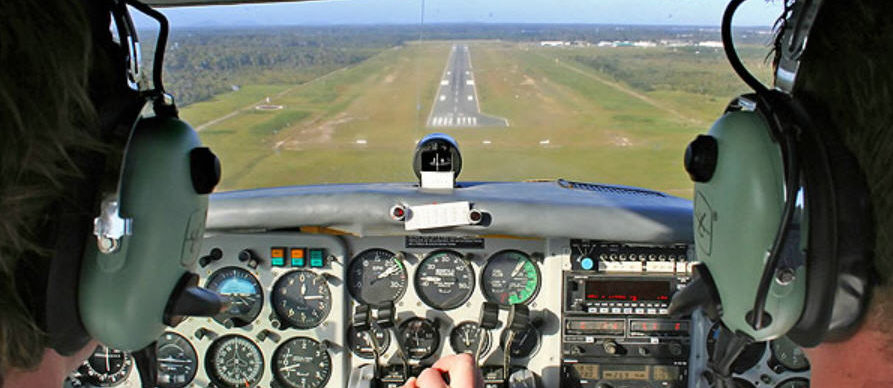
Performing the takeoff
Whenever you are performing a take off you must always be ready to abort the takeoff
If you are landing you must always be ready to perform a go-around.
This is the same mentality as always having an emergency landing field/area in site, within gliding distance in case of an engine (full or partial) loss of power and whether at a cruising altitude or on takeoff.
Decision Points
For takeoffs, this is the distance down the runway the aircraft must become airborne to meet climb and obstacle clearance.
You must determine the aircraft’s liftoff distance using the POH performance graphs.
All pilots must calculate this as per the regulations.
Pick a reference point on the runway that the aircraft should be airborne by – for example:
- Taking off on runway 29 at Hanscom, the aircraft normally becomes airborne passing taxiway G (2,500’) or taxiway F (2,800’) on the left hand side of the runway.
- Taking off on runway 11 at Hanscom, passing taxiway N is 2,500’ on the left hand side of the runway.
- Taking off on runway 23 at Hanscom, passing taxiway E is 2,500’ on the left hand side of the runway.
- Taking off on runway 5 at Hanscom, passing taxiway E is 2,500’ on the left hand side of the runway.
If the aircraft is not airborne by the time you have reached the decision point.
- Reduce power to idle and use brakes to SLOW TO TAXI SPEED TO EXIT THE RUNWAY safely and under control
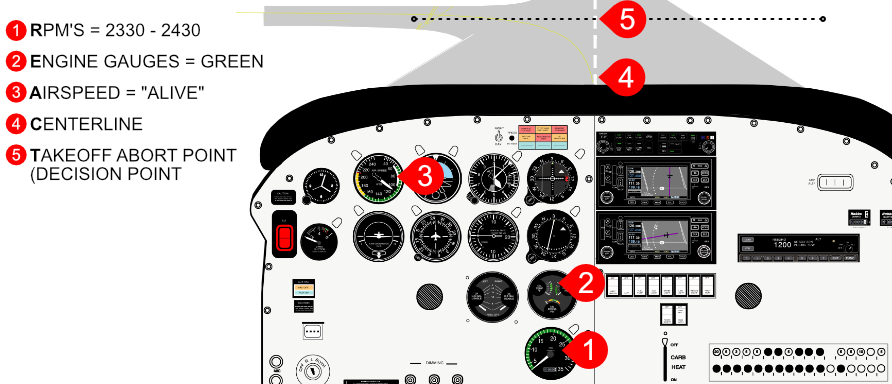
REACT Checklist on takeoff
On take off REACT
- RPM – STATIC RPM must be checked before releasing the brakes for a short field takeoff and during the initial part of the takeoff roll for other takeoffs. In the case where the brakes are not held for a normal or softy field takeoff, teach to confirm the RPM needle points to the 1 to 1:30 O’clock position (round dial instruments) which should be the static rpm.
- Engine Gauges – Gauges should be reading normal / in the green
- Airspeed – As the plane begins to roll – the ASI should be showing the airspeed as “alive”. If its not – stop!
- Centerline. Ensure you’re on the center line and tracking correctly. If a cross wind has created an unstable ground run – abort.
- Takeoff abort point.(decision point)